
Improving disk read performance
When I started working on analyzing the startup time of a browser, I didn’t have an idea where to start. For me, Performance was a number game and trial-n-error approach. The challenge I was looking into is described in bug 1270977, in which the chrome binary hosted on two different partitions behaved differently.
| BROWSER | LaCrOS | Mount point | Partition | fs type | comment |
|---|---|---|---|---|---|
| B1 | stateful | /run/imageloader/lacros-*/chrome | stateful | squashfs | downloaded |
| B2 | deployedLacros | /usr/local/lacros-chrome | stateful | ext4 | pushed by developer |
You can learn more about LaCrOS in my previous blog. From the above table, the difference in filesystem was the first suspect. Squashfs is a compressed read-only file system for Linux.
To emulate the first launch, all caches are cleared using drop_caches as below.
echo 3 > /proc/sys/vm/drop_caches
How to measure a file system read time?
For investigation and testing/benchmarking, sequential read requests are emulated using a dd command and random read requests are emulated using fio(Flexible IO Tester)
For sequential read, B1 took around 92MB/s while B2 took 242MB/s.(Higher read speed means faster). Its a huge difference. ext4 is faster than squashfs.
localhost ~ # echo 3 > /proc/sys/vm/drop_caches
localhost ~ # time dd
if=/run/imageloader/lacros-dogfood-dev/99.0.4824.0/chrome of=/dev/null bs=4096
43910+1 records in
43910+1 records out
179859368 bytes (180 MB, 172 MiB) copied, 1.93517 s, 92.9 MB/s

real    0m1.951s
user    0m0.020s
sys 0m0.637s
localhost ~ # echo 3 > /proc/sys/vm/drop_caches
localhost ~ # time dd if=/usr/local/lacros-chrome/chrome of=/dev/null bs=4096
43910+1 records in
43910+1 records out
179859368 bytes (180 MB, 172 MiB) copied, 0.744337 s, 242 MB/s

real    0m0.767s
user    0m0.056s
sys 0m0.285s
As Squashfs is a compressed file system, it first uncompresses the data and then performs a read. So definitely it’s going to be slower than ext4 but the difference(242 -92) was huge and unacceptable.
Can we do better?
The next step was to find some tools that could provide more information.
- strace - Linux utility to find out system calls that take more time or have blocking IO. But couldn’t get much information out of this analysis.
- iostat - This provides more insight information for input/output
$echo 3 > /proc/sys/vm/drop_caches && iostat -d -tc -xm 1 20
After running this command for both B1 and B2, it appears that B1 is not merging read requests. In other words, rrqm/s and %rrqm values are ZERO. Refer man-iostat
%rrqm The percentage of read requests merged together before being sent to the device.
rrqm/s The number of read requests merged per second that were queued to the device.
The data to be read is scattered in different sectors of a different block. As a result of scattering, the read requests were not merged, so there could be a lot of read requests down to the block device.
Next step was to find out who is responsible for merging read requests.
IO scheduler
IO scheduler optimizes disk access requests by merging I/O requests to similar locations on disk. To get the current IO scheduler for a disk-device
$/sys/block/<disk device>/queue/scheduler
for B1,
localhost ~ # cat /sys/block/dm-1/queue/scheduler
none
For B2, it uses the bfq scheduler
localhost ~ # cat /sys/block/mmcblk0/queue/scheduler
mq-deadline kyber [bfq] none
As you can notice, B1 does not have scheduler. For B2, scheduler is bfq(Budget Fair Queueing).
SUSE and IBM has good documentation about IO scheduling.
It has been found so far that there are differences between file systems, read request merge patterns, and IO schedulers. But there is one more difference which we havent noticed yet.
If you look at how B1 is mounted, you will see that we are using a virtual device.
localhost ~ # df -TH
Filesystem  Type      Size  Used  Avail  Use%  Mounted on
/dev/dm-1   squashfs  143M  143M      0  100%  /run/imageloader/lacros-dogfood-dev/99.0.4824.0
A twist in my story
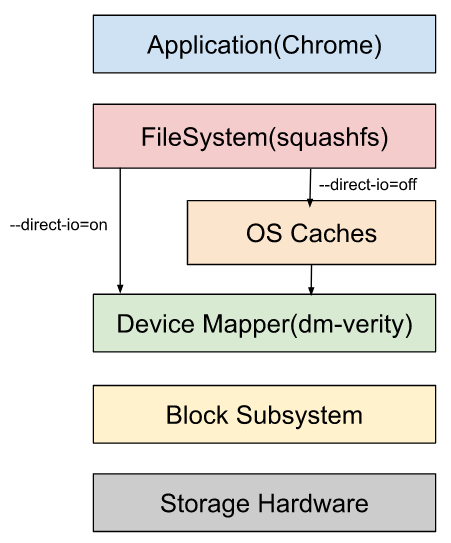
For B1, we are not directly communicating with the block device instead the requests are going through a virtual device using a device mapper.
As you might have noticed above, dm-1 device mapper virtual device is used by B1.
Read more about a device-mapper and refer to the diagram on wikipedia page.
We are using a dm-verity as a virtual device.
Device-Mapper’s “verity” target provides transparent integrity checking of block devices using a cryptographic digest provided by the kernel crypto API. This target is read-only.
From a security point of view, it makes sense to host your executable binary to a read-only files system that provides integrity checking.
There is a twist in that dm-verity does not have a scheduler, and scheduling is delegated to the scheduler of the underlying block device. The I/O will not be merged at the device-mapper layer, but at an underlying layer.
Several layers are different between B1 and B2, including partition encryption(dm-verity) and compression(squashfs).
In addition, we found that B1 defaults to using --direct-io
What is DIRECT IO ?
Direct I/O is a feature of the file system whereby file reads and writes go directly from the applications to the storage device, bypassing the operating system read and write caches.
Although direct I/O can reduce CPU usage, using it typically results in the process taking longer to complete, especially for relatively small requests. This penalty is caused by the fundamental differences between normal cached I/O and direct I/O.
Every direct I/O read causes a synchronous read from the disk; unlike the normal cached I/O policy where the read may be satisfied from the cache. This can result in very poor performance if the data was likely to be in memory under the normal caching policy.
Is it possible to control how many read requests are made?
We decided to go deeper and analyze the block layer. In the block layer the request queue is handled, and I/O scheduling is done. To see how the flow of IO goes through the block layer, there is a suit of tools consisting of
- blktrace (tracing the IO requests through the block layer),
- blkparse (parsing the output of blktrace to make it human readable),
- btrace (script to combine blktrace and blkparse, and
- btt (a blktrace output post-processing tool)), among others.
Below is the result of block-level parsing.
For B1,
| ALL | MIN | AVG | MAX | N |
|---|---|---|---|---|
| Q2Q | 0.000000001 | 0.000069861 | 0.004097547 | 94883 |
| Q2G | 0.000000242 | 0.000000543 | 0.000132620 | 94884 |
| G2I | 0.000000613 | 0.000001455 | 0.003585980 | 94884 |
| I2D | 0.000001399 | 0.000002456 | 0.003777911 | 94884 |
| D2C | 0.000133042 | 0.000176883 | 0.001771526 | 23721 |
| Q2C | 0.000136308 | 0.000181337 | 0.003968613 | 23721 |
For B2,
| ALL | MIN | AVG | MAX | N |
|---|---|---|---|---|
| Q2Q | 0.000000001 | 0.000016582 | 0.003283451 | 76171 |
| Q2G | 0.000000178 | 0.000000228 | 0.000016893 | 76172 |
| G2I | 0.000000626 | 0.000005904 | 0.000587304 | 76172 |
| I2D | 0.000002011 | 0.000007582 | 0.000861783 | 76172 |
| D2C | 0.000004959 | 0.000067955 | 0.001275667 | 19043 |
| Q2C | 0.000009132 | 0.000081670 | 0.001315828 | 19043 |
- Number of read requests(N) are more for B1 than B2.
- For B1, N = 94883 (partition with
squashfs + dm-verity) - For B2, N = 76171 (ext4 partition)
- For B1, N = 94883 (partition with
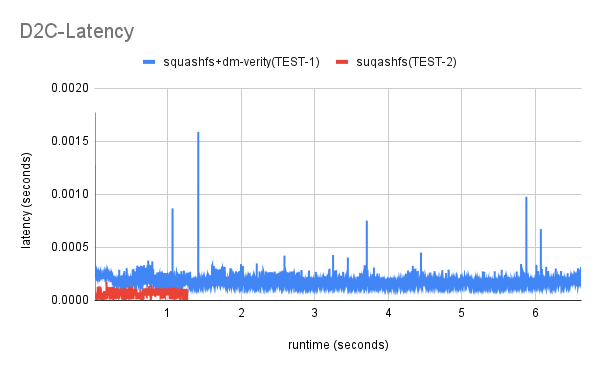
- Average D2C time for B1 is more than twice that of B2
(0.000176883 > 2*0.000067955).
D2C time: the average time from when the actual IO was issued to the driver until is completed (completion trace) back to the block IO layer.
--d2c-latencies option: This option instructs btt to generate the D2C latency file. This file has the first column (X values) representing runtime (seconds), while the second column (Y values) shows the actual latency for command at that time (either Q2D, D2C or Q2C).
FIO(Flexible IO Tester)
Up until now, all analysis has been performed using a dd which emulate sequential read requests.
Read access pattern also affects a IO performace so to emulated a random IO workloads tools like FIO is useful.
When you specify a --size, FIO creates a file with filename and when you don’ specify it FIO reads form a filename.
We are testing an existing chrome binary without providing its size.
localhost~# fio --name=4k_read --ioengine=libaio --iodepth=1 --rw=randread --bs=4k --norandommap --filename=<dir>/chrome
Hotspots
A “hotspot” is a place where the app is spending a lot of time. After performing above analysis, find those areas and speed them up. This is easily done using a profiling tool like It has been found so far that there are differences between file systems, read request merge patterns, and IO schedulers. But there one more difference which we havent noticed yet.
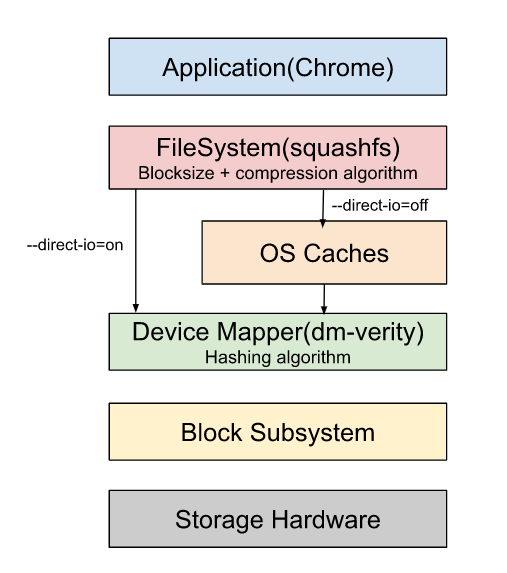
For optimal performance,
- reduce the number of requests (N)
- by tuning the blocksize of the filesystem(squashfs) of the partition
- reduce the time taken to process each request(D2C)
- by tuning a compression algorithm used by squashfs filesystem
- by tuning a hashing function used by dm-verity
Tuning a blocksize
Block is a continuous location on the hard drive where data is stored. In general, FileSystem stores data as a collection of blocks. When the block size is small, the data gets divided into blocks and distributed in more blocks. As more blocks are created, there will be more number of read requests.
Squashfs compresses files, inodes, and directories, and supports block sizes from 4 KiB up to 1 MiB for greater compression.
We experimented with different block sizes of 4K, 64K, 128K, 256K. As the block size is increasing, the read speed for DD is increasing. We have chosen 128K.
mksquashfs /tmp/squashfs-root /home/chronos/cros-components/lacros-dogfood-dev/100.0.4881.0/image.squash.test.<block-size> -b <block-size>K
Tuning a compression algorithm
Squashfs supports different compression algorithms. mksquashfs command has the option -comp <comp> to configure the compression algorithm. There are different compressors available:
- gzip (default)
- lzma
- lzo
- lz4
- xz
- zstd
mksquashfs /tmp/squashfs-root /home/chronos/cros-components/lacros-dogfood-dev/100.0.4881.0/image.squash.test.<block-size> -b <block-size>K -comp gzip
Tuning a hashing algorithm
This is related to dm-verity. dm-verity decrypt the read request. It uses different hashing algorithms.
- sha256 (default)
- sha224
- sha1
- md5 We can use hardware implementation of the above algorithms to speed up things.
Conclusion
The purpose of this blog post is to demonstrate how to identify the hotspot and how to explore different parameters affecting the system’s performance. It was an interesting experience and I learned a lot. By sharing all the details about how the problem was broken down and improved, I hope others can learn something as well. As a result of playing around with the various combinations of parameters such as blocksize, compression, and direct-io, we have decided to go with the following configuration.
- For Filesystem,
- Blocksize : Changed from
4Kto128K - Compression algorithm : Changed from
gziptoxz - direct-io : Changed from
ontooff
- Blocksize : Changed from
- dm-verity :
- Hashing algorithm : Currently it used
sha256. Either use hardware implementation ofsha256or switch to other algorithm.
- Hashing algorithm : Currently it used
Your first step should be to identify your current stack and then analyze each layer of your file system stack using the available tools and optimize them. The information provided in this blog may be helpful to you in deciding what to do about your own performance issues. You can get it touch with me if you need any help.